'%3e%3cpath%20id='Path_84134'%20data-name='Path%2084134'%20d='M463.506,45.319c.05.9.033,1.834,0,2.733-1.366,37.226-54.177,81.06-91.112,74.809-10.2-1.727-25.263-14.509-28.533-24.267-15.13,5.322-37.38,18.858-48.975,1.253-12.431,4.049-23.175,12.207-36.808,6.808-20.683-8.185-3.374-45.768-11.014-51.912-2.3-1.854-8.933-1.069-10.547,1.039-2.242,2.926-6.341,21.882-8.85,27.765-3.571,8.359-13.353,25.463-23.472,25.891-15.541.655-21.848-26.856-28.537-27-5.432-.117-17.813,29.362-23.435,28.376L134.186,80.861c-2.953.01-18.631,26.612-25.052,28.436C98.42,112.344,96,96.145,90.188,90.426c-32.439,42.695-68.161,11.245-52.994-34.914,7.583-23.078,26.539-38.048,51.5-34.664,21.407,2.9,22.66,29.515,1.617,27.1-8.853-1.016-12.491-7.517-21.5.728-5.876,5.379-18.314,32.552-6.047,33.594,12.11-1.8,18.073-30.407,32.215-23.94,4.3,1.968,10.122,15.528,14.97,12.755,3.869-5.435,22.009-30.661,27.037-31.249,8.141-.949,14.342,17.956,19.223,23.242,4.149.986,15.387-27.538,25.42-22.587,5.051,2.492,17.823,34.667,22.67,33.514l8.9-19.871c-.184-3.531-7.266-5.315-8.913-11.509-4.657-17.522,11-29.482,25.954-20.322,3.384,2.071,5.365,7.109,7.306,7.771,7.914,2.686,26.789-3.448,33.534,3.568,6.688,6.959,1.417,31.867,2.612,42.481.187,1.65.217,4.149,2.232,4.634,1.824.441,12.615-4.6,13.657-6.742,3.832-7.884-3.464-37.219,5.659-43.553,7.163-4.968,17.475-3.885,20.773,4.978,2.84,7.644.334,9.575.311,15.975-.02,4.41-.722,26.435,1.607,27.892,5.245.611,13.54-.668,13.647-7.283.124-7.35-2.218-15.9-1.42-24.631C332.382,22.97,351.861,5.8,376.573,13.519c3.762,1.173,10.764,5.756,13.37,5.746,4.75-.017,18.494-8.389,27.668-9.294,22.346-2.2,44.569,11.405,45.9,35.348m-92.128-5.472c-30.514-.9-8.622,59.9,11.014,56.829,15.3-2.4,49.273-25.279,51.912-41.445,1.416-8.679-1.771-15.464-11.355-15.494-17.118-.05-48.391,37.52-51.571.11'%20transform='translate(78.646%2022.796)'%20fill='%231c63b7'/%3e%3cpath%20id='Path_84135'%20data-name='Path%2084135'%20d='M4.982,97.261c6.2-6.448,22.988-7.908,26.125,2.492,2.432,8.055-2.148,13.4,9.4,16.617,13.3,3.7,45.481-9.528,38.946-23.642C72.111,76.873.709,78.864,3.235,43.041,5.62,9.193,78.194-9.863,104.242,5.241c18.765,10.881,9.01,34.881-7.677,29.485-4.644-1.5-8.93-8.312-14.946-9.742-10.694-2.542-25.767.965-35.4,6.01-8.506,4.453-17.556,11.429-5.529,18.26,17.429,9.9,61.693,13.9,65.5,37.383,7.413,45.741-62.679,68.529-94.677,44.879-10.323-7.63-16.343-24.05-6.528-34.256'%20transform='translate(-0.001%200.002)'%20fill='%231c63b7'/%3e%3cpath%20id='Path_84136'%20data-name='Path%2084136'%20d='M122.432,4.842C146.756.426,150.8,31.288,128.615,34.3c-20.993,2.85-26.235-25.814-6.184-29.455'%20transform='translate(257.1%2010.325)'%20fill='%231c63b7'/%3e%3c/g%3e%3c/svg%3e)
'%20fill='%231c63b7'/%3e%3c/clipPath%3e%3c/defs%3e%3cg%20id='Group_820'%20data-name='Group%20820'%20transform='translate(0%200)'%3e%3cg%20id='Group_819'%20data-name='Group%20819'%20clip-path='url(%23clip-path)'%3e%3cpath%20id='Path_28'%20data-name='Path%2028'%20d='M162.285,20.389c.015.268.01.549,0,.818-.409,11.143-16.217,24.264-27.273,22.393-3.053-.517-7.562-4.343-8.541-7.264-4.529,1.593-11.189,5.645-14.66.375-3.721,1.212-6.937,3.654-11.018,2.038-6.191-2.45-1.01-13.7-3.3-15.539a3.018,3.018,0,0,0-3.157.311c-.671.876-1.9,6.55-2.649,8.311-1.069,2.5-4,7.622-7.026,7.75-4.652.2-6.54-8.039-8.542-8.081-1.626-.035-5.332,8.789-7.015,8.494l-5.4-8.967c-.884,0-5.577,7.966-7.5,8.512-3.207.912-3.93-3.937-5.671-5.649-9.71,12.78-20.4,3.366-15.863-10.451,2.27-6.908,7.944-11.389,15.415-10.376,6.408.869,6.783,8.835.484,8.111-2.65-.3-3.739-2.25-6.436.218-1.759,1.61-5.482,9.744-1.81,10.056,3.625-.539,5.41-9.1,9.643-7.166,1.286.589,3.03,4.648,4.481,3.818,1.158-1.627,6.588-9.178,8.093-9.354,2.437-.284,4.293,5.375,5.754,6.957,1.242.3,4.606-8.243,7.609-6.761,1.512.746,5.335,10.377,6.786,10.032l2.663-5.948c-.055-1.057-2.175-1.591-2.668-3.445-1.394-5.245,3.292-8.825,7.769-6.083,1.013.62,1.606,2.128,2.187,2.326,2.369.8,8.019-1.032,10.038,1.068,2,2.083.424,9.539.782,12.716.056.494.065,1.242.668,1.387.546.132,3.776-1.376,4.088-2.018,1.147-2.36-1.037-11.141,1.694-13.037,2.144-1.487,5.231-1.163,6.218,1.49.85,2.288.1,2.866.093,4.782-.006,1.32-.216,7.913.481,8.349,1.57.183,4.053-.2,4.085-2.18.037-2.2-.664-4.76-.425-7.373.668-7.31,6.5-12.45,13.9-10.139,1.126.351,3.222,1.723,4,1.72,1.422-.005,5.536-2.511,8.282-2.782,6.689-.66,13.341,3.414,13.738,10.581m-27.577-1.638c-9.134-.27-2.581,17.931,3.3,17.011,4.581-.717,14.749-7.567,15.539-12.406.424-2.6-.53-4.629-3.4-4.638-5.124-.015-14.485,11.231-15.437.033'%20fill='%231c63b7'/%3e%3cpath%20id='Path_29'%20data-name='Path%2029'%20d='M1.491,29.114c1.856-1.93,6.881-2.367,7.82.746.728,2.411-.643,4.012,2.813,4.974,3.982,1.109,13.614-2.852,11.658-7.077C21.585,23.011.212,23.607.968,12.884,1.682,2.752,23.406-2.952,31.2,1.569c5.617,3.257,2.7,10.441-2.3,8.826-1.39-.45-2.673-2.488-4.474-2.916-3.2-.761-7.713.289-10.6,1.8-2.546,1.333-5.255,3.421-1.655,5.466,5.217,2.964,18.467,4.162,19.606,11.19C34,39.626,13.023,46.447,3.445,39.368c-3.09-2.284-4.892-7.2-1.954-10.254'%20fill='%231c63b7'/%3e%3cpath%20id='Path_30'%20data-name='Path%2030'%20d='M113.607,4.54c7.281-1.322,8.492,7.916,1.851,8.817-6.284.853-7.853-7.727-1.851-8.817'%20fill='%231c63b7'/%3e%3c/g%3e%3c/g%3e%3c/svg%3e)
Explanation of Results of Operations (First Quarter of FY3/2027)
Summary
(JPY: Million)
| Net Sales | 52,035 | YoY+20.7% |
|---|---|---|
| Operating Profit | 22,435 | YoY+11.1% |
| OP Margin | 43.1% | ー |
| Ordinary Profit | 22,624 | YoY+12.0% |
| Profit Attributable to Owners of Parent | 15,516 | YoY+9.3% |
| Basic Earnings per Share | 12.80Yen | ー |
|---|
【Summary for Q1 of FY3/2027】
- Consolidated net sales and operating profit for the first quarter of FY3/2027 marked a record high for a first quarter.
- A wider range of Sanrio characters continued to gain popularity globally, with greater character use by licensees. The range of product categories featuring our characters also continued to expand.
- Net sales for the first quarter of FY3/2027 progressed largely in line with the full-year forecast.
- Operating profit slightly exceeded the initial forecast, primarily because a portion of the SG&A budget, mainly in Japan, is now expected to be recognized in Q2 and beyond.
We have made no changes to our full-year forecast of 229.8 billion yen in sales (up 18.4% year on year), 89.5 billion yen in operating profit (up 15.0% year on year), and 88.8 billion yen in adjusted operating profit (up 13.2%).
Net Sales
(JPY: Million)
| Net Sales | 52,035 | YoY+20.7% |
|---|
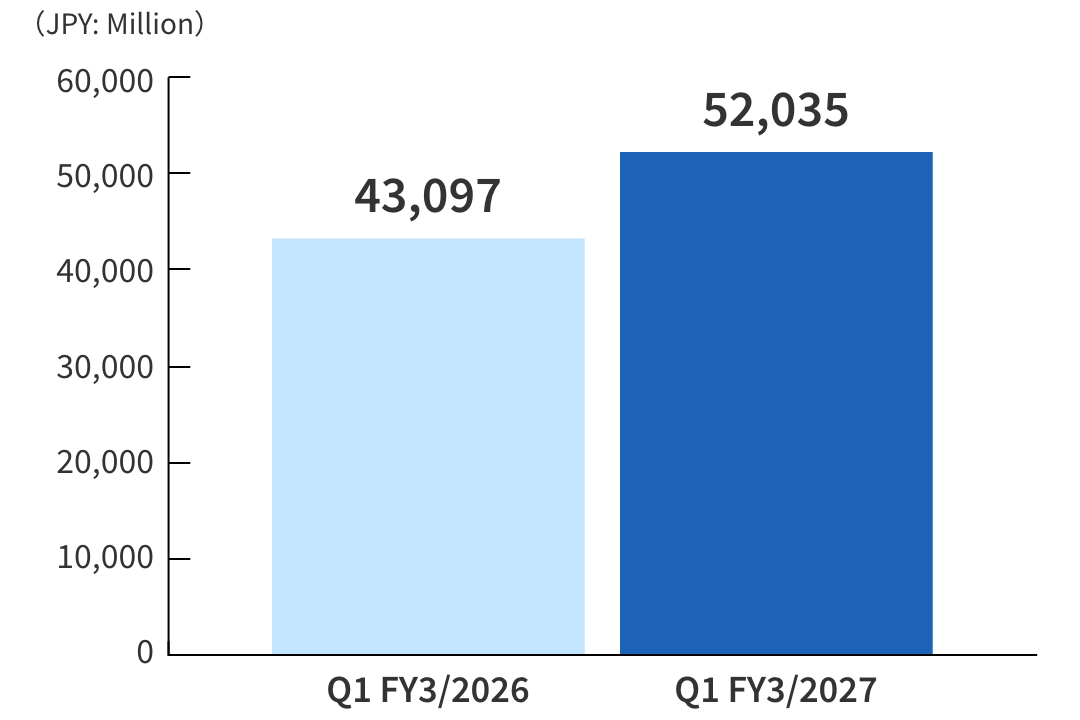
Consolidated net sales and operating profit for the first quarter of FY3/2027 marked a record high for a first quarter.
Net sales for the first quarter of FY3/2027 progressed largely in line with the full-year forecast.
Operating Profit
(JPY: Million)
| Operating Profit | 22,435 | YoY+11.1% |
|---|
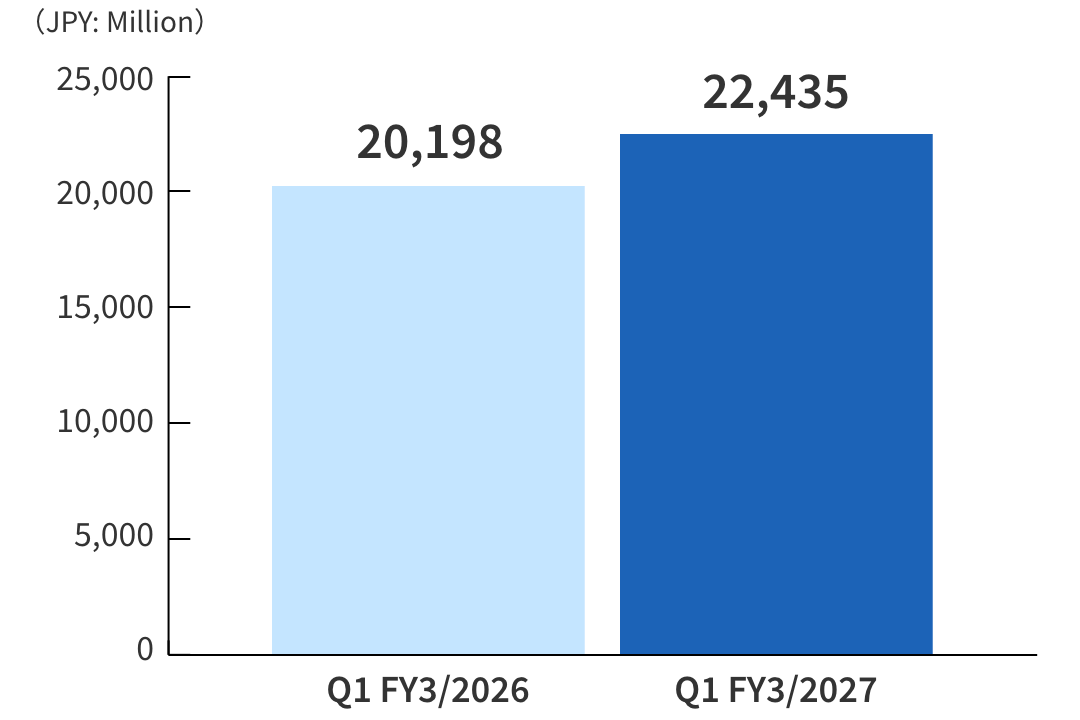
Consolidated net sales and operating profit for the first quarter of FY3/2027 marked a record high for a first quarter.
Operating profit slightly exceeded the initial forecast, primarily because a portion of the SG&A budget, mainly in Japan, is now expected to be recognized in Q2 and beyond.
Reportable Segment
Segment Sales Ratio
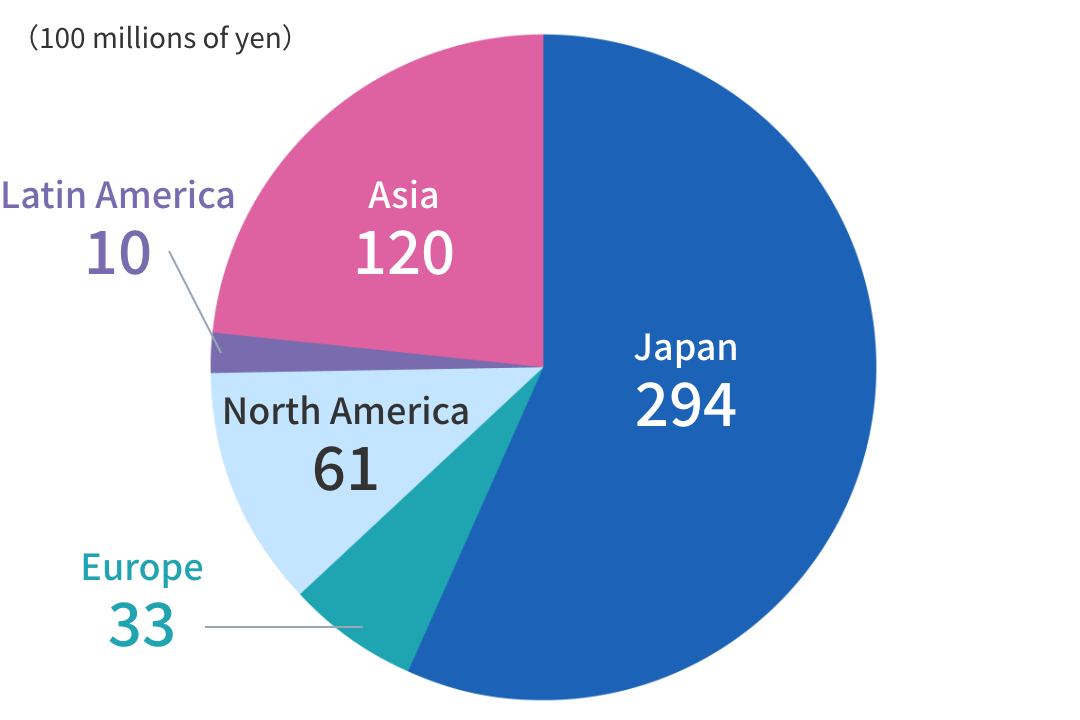
i. Japan: Net sales rose 20.2% year-on-year to 29.4 billion yen and operating profit rose 25.0% to 14.9 billion yen.
In the product sales business, a significant increase in the number of domestic customers contributed to sales growth. This success was achieved through the popularity of a wide range of characters with fans, product development that reflected customer needs, and continued efforts to maximize sales opportunities in stores. In connection with the 2026 Sanrio character ranking (April 9–May 24), the Company featured a wide range of characters, which also helped strengthen its business foundation by expanding its fan base.
The licensing business performed steadily as licensees featured a wide range of Sanrio characters, led by Hello Kitty and including Pompompurin. By category, the business performed well across a wide range of areas, including sundries, toys such as capsule toys, confectionery and food, and general merchandise.
Operating profit rose due to an increase in sales.
ii. Europe: Net sales rose 56.0% year-on-year to 3.3 billion yen and operating profit rose 38.9% year-on-year to 0.8 billion yen.
In the licensing business, sales rose significantly, driven by the continued strategy of featuring multiple Sanrio characters together and successful initiatives with global brands. Growth was driven in particular by collaborations with major fast-fashion brands operating in various countries across Europe, initiatives with stationery and general merchandise licensees, and the toy category featuring multiple Sanrio characters together. In addition, with a view to enhancing brand value, the Company also held an event at the Women‘s Alpine Ski World Cup.
Operating profit increased due to an increase in sales.
iii. North America: Net sales rose 6.0% year-on-year to 6.1 billion yen and operating profit fell 19.9% year-on-year to 2.2 billion yen.
In the licensing business, sales were strong in the toy and apparel categories. The toy category performed well, supported by initiatives with licensees handling a wide range of toys and by strong sales of collaboration products featuring popular characters from other companies. The apparel category also remained solid through initiatives with existing licensees.
As part of its initiatives to expand customer touchpoints, the North American subsidiary held several collaborative events. These included events in partnership with professional sports leagues such as MLB (baseball), NHL (ice hockey), NBA (basketball), NFL (American football) and MLS (soccer).
Although sales were higher, operating profit decreased due to an increase in marketing expenses.
iv. Latin America: Net sales rose 70.0% year-on-year to 1.0 billion yen and operating profit rose 11.7% year-on-year to 0.2 billion yen.
In Latin America as a whole, the licensing business performed well in the categories of apparel, health & beauty, stationery, accessories and bags.
In Mexico, strong performances were seen in the apparel category, where children’s clothing sold well, and the health & beauty category, where hygiene products performed well.
In Brazil, the apparel category performed well, driven by children‘s clothing featuring a wide range of Sanrio characters, while the stationery category also delivered strong results. In Latin America as a whole, major global brands performed well across multiple categories featuring Sanrio characters, including accessories and children‘s bags.
Operating profit increased due to sales growth and the impact of foreign exchange rate fluctuations.
v. Asia: Net sales rose 19.8% year-on-year to 12.0 billion yen and operating profit fell 4.9% to 5.5 billion yen.
In mainland China, the Company continued to expand the range of product categories in which Sanrio characters are featured in its licensing business. While the toy category remained the core focus, it also placed greater emphasis on the interior and kitchen categories. Alongside the growing popularity of Hello Kitty, the Company is also promoting various characters including My Sweet Piano and Cogimyun. The product sales business promoted the development and sale of original products for the Chinese market in addition to expanding its store network.
In South Korea, licensing business sales in the health & beauty, digital and toy categories were strong. Hello Kitty and Pompompurin contributed to sales growth.
In Taiwan, the licensing business performed well in the toy and apparel categories. The strategic deployment of multiple Sanrio characters together proved successful. Notably, the popularity of Kuromi has surged, leading to significant sales growth.
In the Hong Kong and Macau region, the licensing business saw growth in sales, driven by the success of the corporate special sales category, which implemented initiatives mainly in collaboration with theme parks and financial institutions.
In Southeast Asia, the strategy of featuring multiple Sanrio characters together contributed to sales growth in the licensing business. By category, in addition to a strong performance in the category of multiple toys, the corporate special sales category also performed well, contributing to sales growth. While Hello Kitty maintained her popularity, characters other than Hello Kitty grew in popularity, including Kuromi, My Melody and Cinnamoroll.
Although sales were higher, operating profit in Asia decreased due to an increase in SG&A expenses.
Explanation of Financial Position
(JPY: Million)
| Total Assets | 247,713 | YoY+5.6% |
|---|---|---|
| Net Assets | 163,375 | YoY+4.7% |
| Equity Ratio | 65.9% | ー |
Total Assets
(JPY: Million)
| Total Assets | 247,713 | YoY+5.6% |
|---|
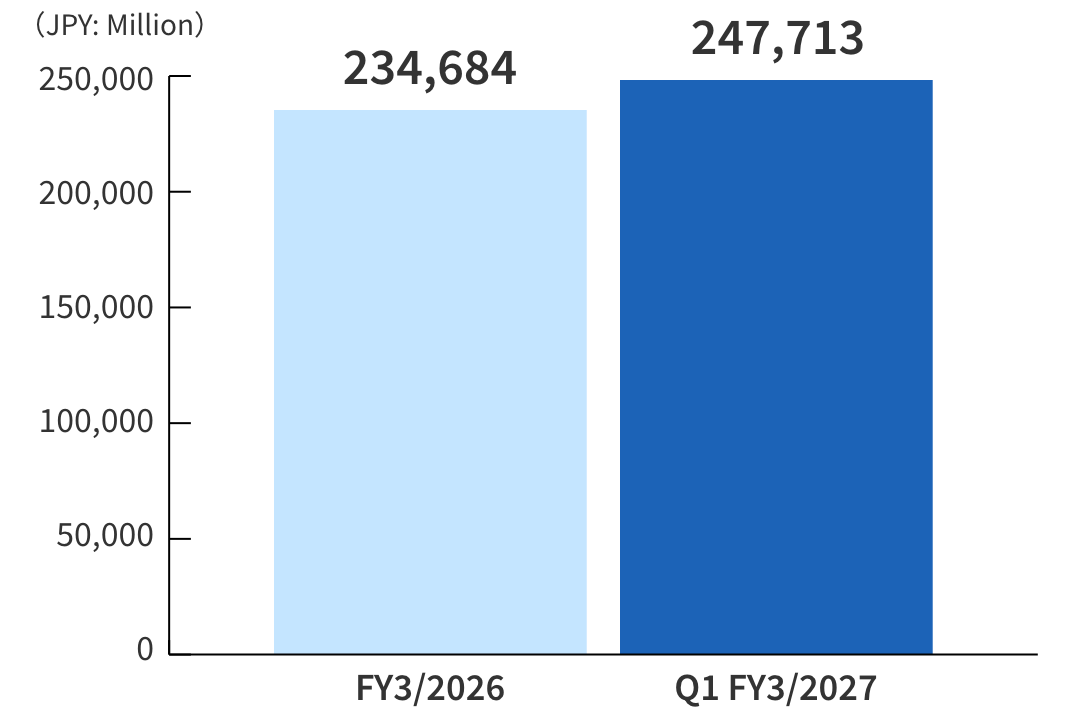
At the end of the first quarter of the current fiscal year, total assets stood at 247.7 billion yen, an increase of 13.0 billion yen from the end of the previous fiscal year. The main increases were 10.6 billion yen in cash and deposits, 1.7 billion yen in merchandise and finished goods, and 0.9 billion yen in other current assets.
Liabilities increased 5.6 billion yen from the end of the previous fiscal year to 84.3 billion yen. The main increases were 2.0 billion yen in notes and accounts payable-trade, 1.8 billion yen in contract liabilities, 0.8 billion yen in provision for bonuses and 5.8 billion yen in other current liabilities. The main decrease was 4.5 billion yen in income taxes payable.
Net Assets
(JPY: Million)
| Net Assets | 163,375 | YoY+4.7% |
|---|
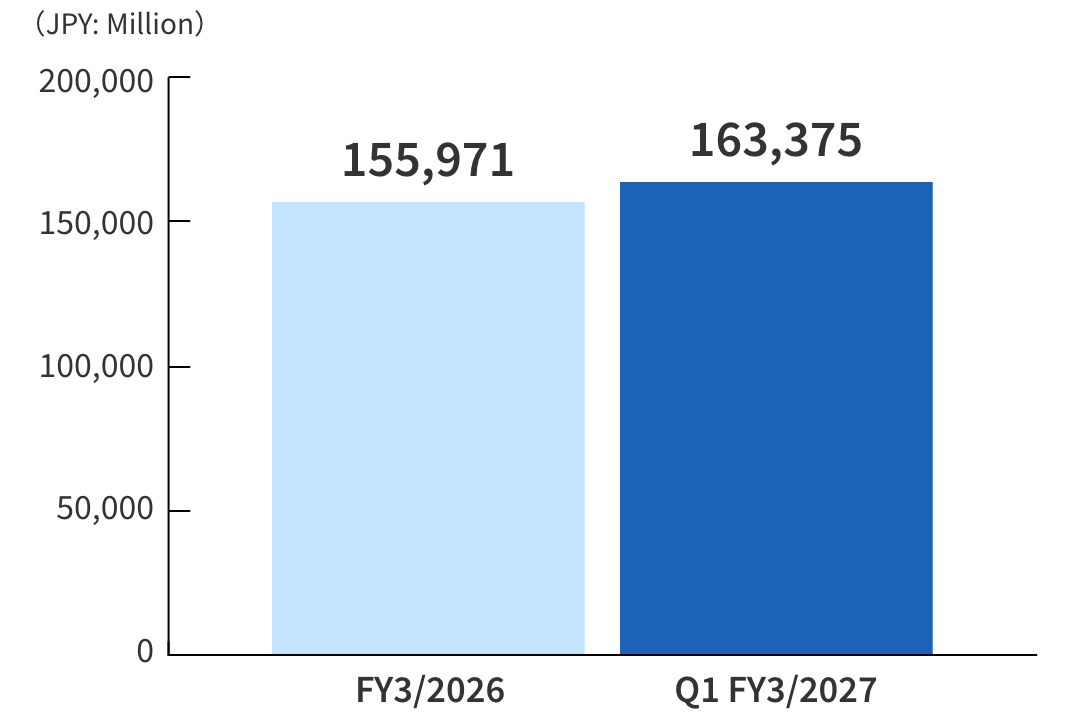
Net assets increased 7.4 billion yen from the end of the previous fiscal year to 163.3 billion yen. The main increases were 6.3 billion yen in retained earnings and 1.3 billion yen in foreign currency translation adjustment.
As a result, the equity ratio was 65.9%, down 0.5 percentage points from the end of the previous fiscal year.