'%3e%3cpath%20id='Path_84134'%20data-name='Path%2084134'%20d='M463.506,45.319c.05.9.033,1.834,0,2.733-1.366,37.226-54.177,81.06-91.112,74.809-10.2-1.727-25.263-14.509-28.533-24.267-15.13,5.322-37.38,18.858-48.975,1.253-12.431,4.049-23.175,12.207-36.808,6.808-20.683-8.185-3.374-45.768-11.014-51.912-2.3-1.854-8.933-1.069-10.547,1.039-2.242,2.926-6.341,21.882-8.85,27.765-3.571,8.359-13.353,25.463-23.472,25.891-15.541.655-21.848-26.856-28.537-27-5.432-.117-17.813,29.362-23.435,28.376L134.186,80.861c-2.953.01-18.631,26.612-25.052,28.436C98.42,112.344,96,96.145,90.188,90.426c-32.439,42.695-68.161,11.245-52.994-34.914,7.583-23.078,26.539-38.048,51.5-34.664,21.407,2.9,22.66,29.515,1.617,27.1-8.853-1.016-12.491-7.517-21.5.728-5.876,5.379-18.314,32.552-6.047,33.594,12.11-1.8,18.073-30.407,32.215-23.94,4.3,1.968,10.122,15.528,14.97,12.755,3.869-5.435,22.009-30.661,27.037-31.249,8.141-.949,14.342,17.956,19.223,23.242,4.149.986,15.387-27.538,25.42-22.587,5.051,2.492,17.823,34.667,22.67,33.514l8.9-19.871c-.184-3.531-7.266-5.315-8.913-11.509-4.657-17.522,11-29.482,25.954-20.322,3.384,2.071,5.365,7.109,7.306,7.771,7.914,2.686,26.789-3.448,33.534,3.568,6.688,6.959,1.417,31.867,2.612,42.481.187,1.65.217,4.149,2.232,4.634,1.824.441,12.615-4.6,13.657-6.742,3.832-7.884-3.464-37.219,5.659-43.553,7.163-4.968,17.475-3.885,20.773,4.978,2.84,7.644.334,9.575.311,15.975-.02,4.41-.722,26.435,1.607,27.892,5.245.611,13.54-.668,13.647-7.283.124-7.35-2.218-15.9-1.42-24.631C332.382,22.97,351.861,5.8,376.573,13.519c3.762,1.173,10.764,5.756,13.37,5.746,4.75-.017,18.494-8.389,27.668-9.294,22.346-2.2,44.569,11.405,45.9,35.348m-92.128-5.472c-30.514-.9-8.622,59.9,11.014,56.829,15.3-2.4,49.273-25.279,51.912-41.445,1.416-8.679-1.771-15.464-11.355-15.494-17.118-.05-48.391,37.52-51.571.11'%20transform='translate(78.646%2022.796)'%20fill='%231c63b7'/%3e%3cpath%20id='Path_84135'%20data-name='Path%2084135'%20d='M4.982,97.261c6.2-6.448,22.988-7.908,26.125,2.492,2.432,8.055-2.148,13.4,9.4,16.617,13.3,3.7,45.481-9.528,38.946-23.642C72.111,76.873.709,78.864,3.235,43.041,5.62,9.193,78.194-9.863,104.242,5.241c18.765,10.881,9.01,34.881-7.677,29.485-4.644-1.5-8.93-8.312-14.946-9.742-10.694-2.542-25.767.965-35.4,6.01-8.506,4.453-17.556,11.429-5.529,18.26,17.429,9.9,61.693,13.9,65.5,37.383,7.413,45.741-62.679,68.529-94.677,44.879-10.323-7.63-16.343-24.05-6.528-34.256'%20transform='translate(-0.001%200.002)'%20fill='%231c63b7'/%3e%3cpath%20id='Path_84136'%20data-name='Path%2084136'%20d='M122.432,4.842C146.756.426,150.8,31.288,128.615,34.3c-20.993,2.85-26.235-25.814-6.184-29.455'%20transform='translate(257.1%2010.325)'%20fill='%231c63b7'/%3e%3c/g%3e%3c/svg%3e)
'%20fill='%231c63b7'/%3e%3c/clipPath%3e%3c/defs%3e%3cg%20id='Group_820'%20data-name='Group%20820'%20transform='translate(0%200)'%3e%3cg%20id='Group_819'%20data-name='Group%20819'%20clip-path='url(%23clip-path)'%3e%3cpath%20id='Path_28'%20data-name='Path%2028'%20d='M162.285,20.389c.015.268.01.549,0,.818-.409,11.143-16.217,24.264-27.273,22.393-3.053-.517-7.562-4.343-8.541-7.264-4.529,1.593-11.189,5.645-14.66.375-3.721,1.212-6.937,3.654-11.018,2.038-6.191-2.45-1.01-13.7-3.3-15.539a3.018,3.018,0,0,0-3.157.311c-.671.876-1.9,6.55-2.649,8.311-1.069,2.5-4,7.622-7.026,7.75-4.652.2-6.54-8.039-8.542-8.081-1.626-.035-5.332,8.789-7.015,8.494l-5.4-8.967c-.884,0-5.577,7.966-7.5,8.512-3.207.912-3.93-3.937-5.671-5.649-9.71,12.78-20.4,3.366-15.863-10.451,2.27-6.908,7.944-11.389,15.415-10.376,6.408.869,6.783,8.835.484,8.111-2.65-.3-3.739-2.25-6.436.218-1.759,1.61-5.482,9.744-1.81,10.056,3.625-.539,5.41-9.1,9.643-7.166,1.286.589,3.03,4.648,4.481,3.818,1.158-1.627,6.588-9.178,8.093-9.354,2.437-.284,4.293,5.375,5.754,6.957,1.242.3,4.606-8.243,7.609-6.761,1.512.746,5.335,10.377,6.786,10.032l2.663-5.948c-.055-1.057-2.175-1.591-2.668-3.445-1.394-5.245,3.292-8.825,7.769-6.083,1.013.62,1.606,2.128,2.187,2.326,2.369.8,8.019-1.032,10.038,1.068,2,2.083.424,9.539.782,12.716.056.494.065,1.242.668,1.387.546.132,3.776-1.376,4.088-2.018,1.147-2.36-1.037-11.141,1.694-13.037,2.144-1.487,5.231-1.163,6.218,1.49.85,2.288.1,2.866.093,4.782-.006,1.32-.216,7.913.481,8.349,1.57.183,4.053-.2,4.085-2.18.037-2.2-.664-4.76-.425-7.373.668-7.31,6.5-12.45,13.9-10.139,1.126.351,3.222,1.723,4,1.72,1.422-.005,5.536-2.511,8.282-2.782,6.689-.66,13.341,3.414,13.738,10.581m-27.577-1.638c-9.134-.27-2.581,17.931,3.3,17.011,4.581-.717,14.749-7.567,15.539-12.406.424-2.6-.53-4.629-3.4-4.638-5.124-.015-14.485,11.231-15.437.033'%20fill='%231c63b7'/%3e%3cpath%20id='Path_29'%20data-name='Path%2029'%20d='M1.491,29.114c1.856-1.93,6.881-2.367,7.82.746.728,2.411-.643,4.012,2.813,4.974,3.982,1.109,13.614-2.852,11.658-7.077C21.585,23.011.212,23.607.968,12.884,1.682,2.752,23.406-2.952,31.2,1.569c5.617,3.257,2.7,10.441-2.3,8.826-1.39-.45-2.673-2.488-4.474-2.916-3.2-.761-7.713.289-10.6,1.8-2.546,1.333-5.255,3.421-1.655,5.466,5.217,2.964,18.467,4.162,19.606,11.19C34,39.626,13.023,46.447,3.445,39.368c-3.09-2.284-4.892-7.2-1.954-10.254'%20fill='%231c63b7'/%3e%3cpath%20id='Path_30'%20data-name='Path%2030'%20d='M113.607,4.54c7.281-1.322,8.492,7.916,1.851,8.817-6.284.853-7.853-7.727-1.851-8.817'%20fill='%231c63b7'/%3e%3c/g%3e%3c/g%3e%3c/svg%3e)
Explanation of Results of Operations (FY3/2026)
Summary
(JPY: Million)
| Net Sales | 194,088 | YoY+33.9% |
|---|---|---|
| Operating Profit | 77,859 | YoY+50.3% |
| OP Margin | 40.1% | ー |
| Ordinary Profit | 79,335 | YoY+48.4% |
| Profit Attributable to Owners of Parent | 54,608 | YoY+30.9% |
| Basic Earnings per Share | 45.33Yen | ー |
|---|
【Summary for FY 3/2026】
- Net sales and operating profit marked a fifth consecutive year of growth, reaching historical highs at 194.0 billion yen (+33.9% YoY) and 78.4 billion yen (+41.0% YoY), respectively.
- In Japan, ongoing exposure through owned media and licensee promotions proved to be effective. At the same time, the expansion of our store network in mainland China and advancements in fast fashion in Europe contributed to earnings growth.
- Our FY3/2027 earnings forecast calls for continued strong growth, with net sales of 229.8 billion yen (+18.4% YoY) and adjusted operating profit of 88.8 billion yen (+13.2% YoY).
Net Sales
(JPY: Million)
| Net Sales | 194,088 | YoY+33.9% |
|---|
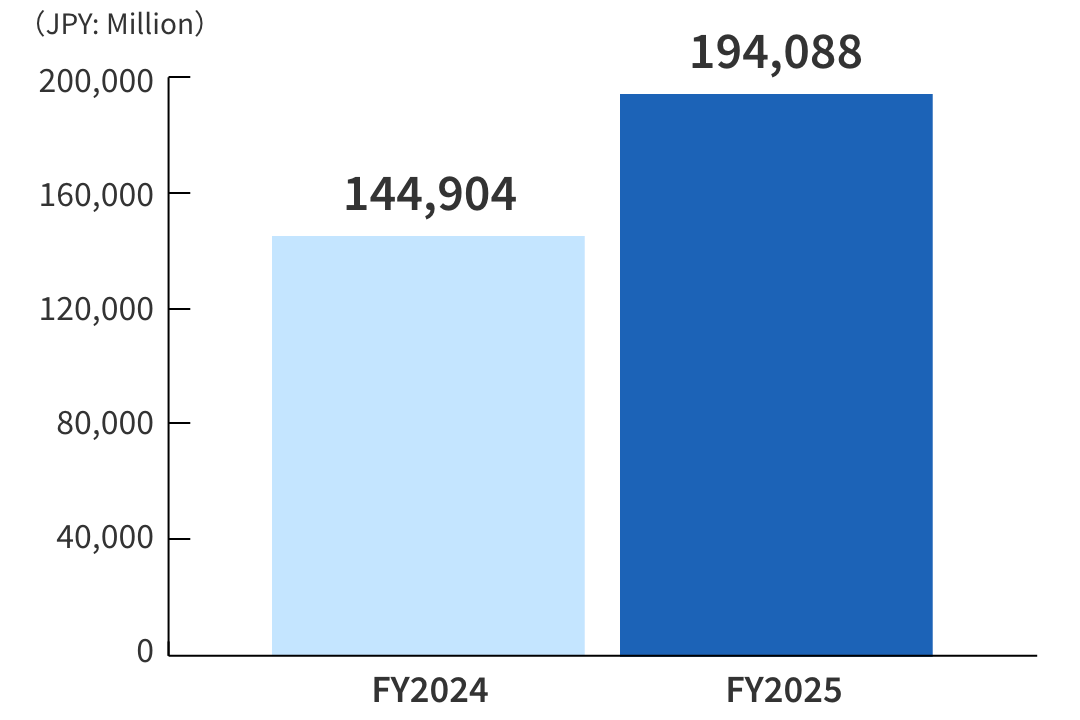
Net sales and operating profit marked a fifth consecutive year of growth, reaching historical highs at 194.0 billion yen (+33.9% YoY) and 78.4 billion yen (+41.0% YoY), respectively.
Operating Profit
(JPY: Million)
| Operating Profit | 77,859 | YoY+50.3% |
|---|
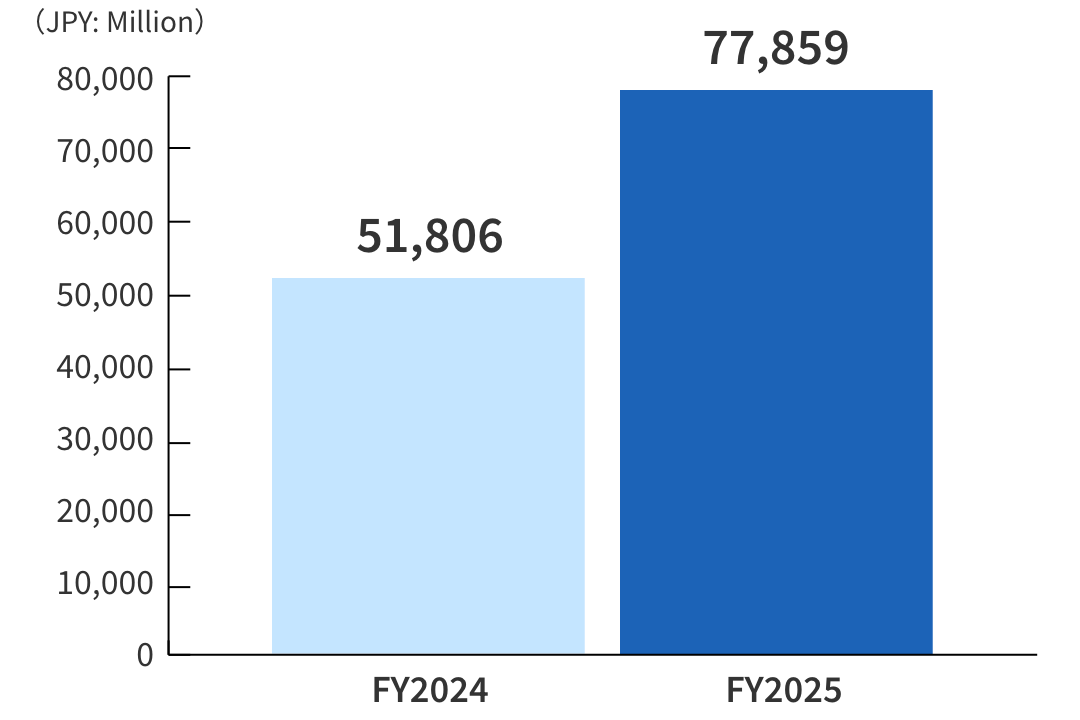
Net sales and operating profit marked a fifth consecutive year of growth, reaching historical highs at 194.0 billion yen (+33.9% YoY) and 78.4 billion yen (+41.0% YoY), respectively.
Reportable Segment
Segment Sales Ratio
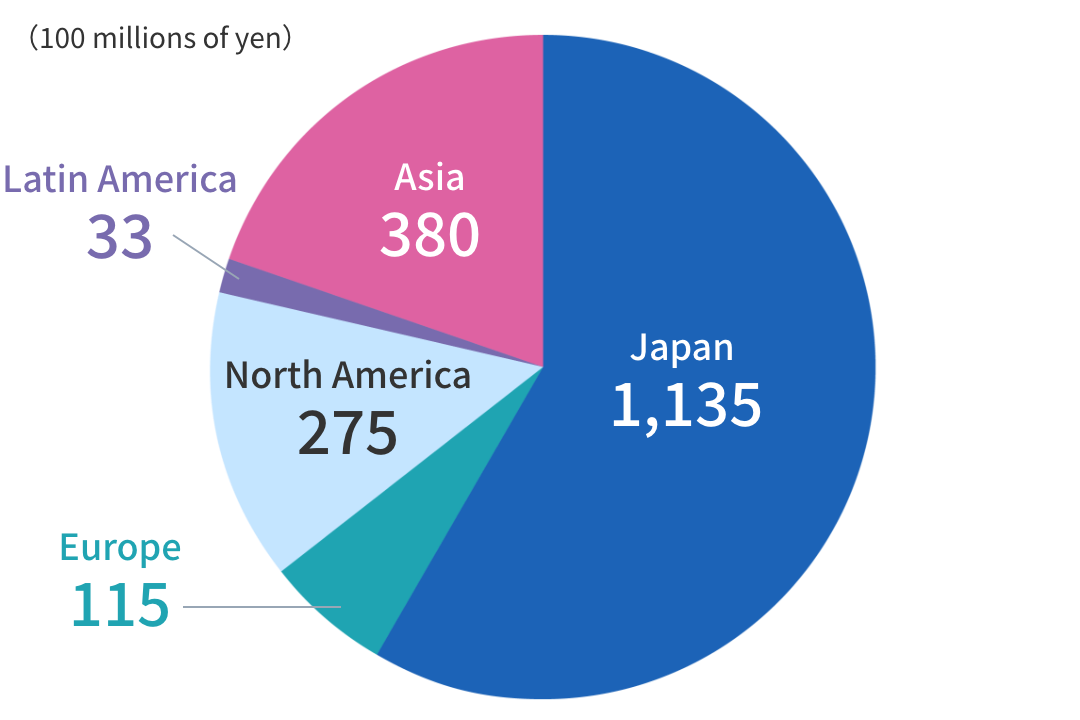
i. Japan: Net sales rose 32.1% year-on-year to 113.5 billion yen and operating profit rose 47.1% to 53.8 billion yen.
In the product sales business, although the number of inbound tourist customers declined after November 2025, a significant increase in domestic customers boosted sales. In particular, the newly opened Tokyo Character Street store (November 2025) and Harajuku store (December 2025) attracted considerable attention, with store-exclusive products proving popular. In addition, improvements in store operations through increasing sales staff numbers, adding more cash registers, and improving the accuracy of automated ordering systems contributed to sales growth.
In the licensing business, the continued popularity of Hello Kitty, together with that of My Melody and Kuromi, both of whom celebrated anniversaries in 2025, and Pompompurin, who has been celebrating his anniversary in 2026, drove strong sales growth across a wide range of categories including beverages, food service, consumer goods, cosmetics, and apparel. Related merchandise attracted attention, reflecting a growing demand for stickers.
Operating profit rose significantly due to a big increase in sales.
ii. Europe: Net sales rose 85.4% year-on-year to 11.5 billion yen and operating profit fell 47.1% year-on-year to 0.8 billion yen.
In the licensing business, sales rose significantly, driven by the continued strategy of featuring a wide range of Sanrio characters and successful initiatives with global brands, along with growth across nearly all categories, particularly in apparel, toys, and beauty.
Operating profit decreased due to a recording of 1.4 billion yen for adjustments forintercompany transactionsarising from differences in fiscal year-ends of consolidated subsidiaries.
iii. North America: Net sales rose 0.4% year-on-year to 27.5 billion yen and operating profit rose 10.0% year-on-year to 9.7 billion yen.
In the licensing business, uncertainty has persisted since July 2025 due to changes in the macroeconomic environment, especially around tariff policies. However, we attracted strong interest by featuring Kuromi—currently being developed as the next key character after Hello Kitty—at a Halloween event. At the same time, we worked to increase brand awareness for our characters by maintaining exposure of multiple Sanrio characters together through social media and YouTube channels. In the digital category, the expansion of distribution platforms for major game titles, along with content updates and additional sales channels, contributed to both sales growth and increased brand awareness.
As part of its initiatives to enhance brand value and expand customer touchpoints, the North American subsidiary held several sports and culture events. These included events in partnership with professional sports leagues such as MLB (baseball), NHL (ice hockey), NBA (basketball), and F1 Academy.
Operating profit increased due to higher sales.
iv. Latin America: Net sales rose 84.5% year-on-year to 3.3 billion yen and operating profit rose 60.4% year-on-year to 0.8 billion yen.
In Latin America as a whole, the licensing business performed well in the categories of apparel, health & beauty, stationery, accessories and bags. In addition, the increased popularity of various Sanrio characters, such as My Melody, who is marking her 50th anniversary, Kuromi, who is celebrating her 20th anniversary, and Cinnamoroll, led to expanded product offerings by major global licensees, contributing to higher sales.
In Mexico, the bag category performed well, driven by strong sales of school bags, as did the stationery category, supported by the popularity of school supplies targeting teenagers. In Brazil, higher sales were driven by the health & beauty category, due to the success of a lip balm created in collaboration with a major pharmaceutical company.
The apparel category also saw higher sales of merchandise featuring Kuromi and Hello Kitty amid their growing popularity.
Operating profit increased due to sales growth.
v. Asia: Net sales rose 62.6% year-on-year to 38.0 billion yen and operating profit rose 140.4% to 16.2 billion yen.
In mainland China, licensing business sales in the toys & hobby, apparel and accessories and corporate special sales categories were strong. The strategic deployment of multiple Sanrio characters together proved successful, with not only Hello Kitty but also Kuromi and My Sweet Piano gaining in popularity. In the product sales business, we opened new stores mainly in major cities such as Shanghai and Beijing, while the launch of region-exclusive products attracted considerable interest, resulting in a substantial increase in sales.
In South Korea, licensing business sales in the health & beauty, corporate special sales and toy categories were strong with Hello Kitty and Pochacco attracting attention.
In Taiwan, the licensing business performed well in the health & beauty and apparel categories. The strategic deployment of multiple Sanrio characters together proved successful. The popularity of Cinnamoroll has further increased in addition to the anniversary character My Melody.
In the Hong Kong and Macau region, the licensing business saw growth in sales, driven by the success of the corporate special sales category, which implemented initiatives in collaboration with financial institutions and local governments.
In Southeast Asia, sales of the licensing business were driven by multi-regional expansion through toy licensees, contributing to sales growth. Hello Kitty maintained her popularity, and the toy and food categories saw sales growth due to the strong performance of multiple Sanrio characters.
Operating profit increased due to sales growth across Asia.
Explanation of Financial Position
(JPY: Million)
| Total Assets | 234,684 | YoY+15.9% |
|---|---|---|
| Net Assets | 155,971 | YoY+44.9% |
| Equity Ratio | 66.4% | ー |
Total Assets
(JPY: Million)
| Total Assets | 234,684 | YoY+15.9% |
|---|
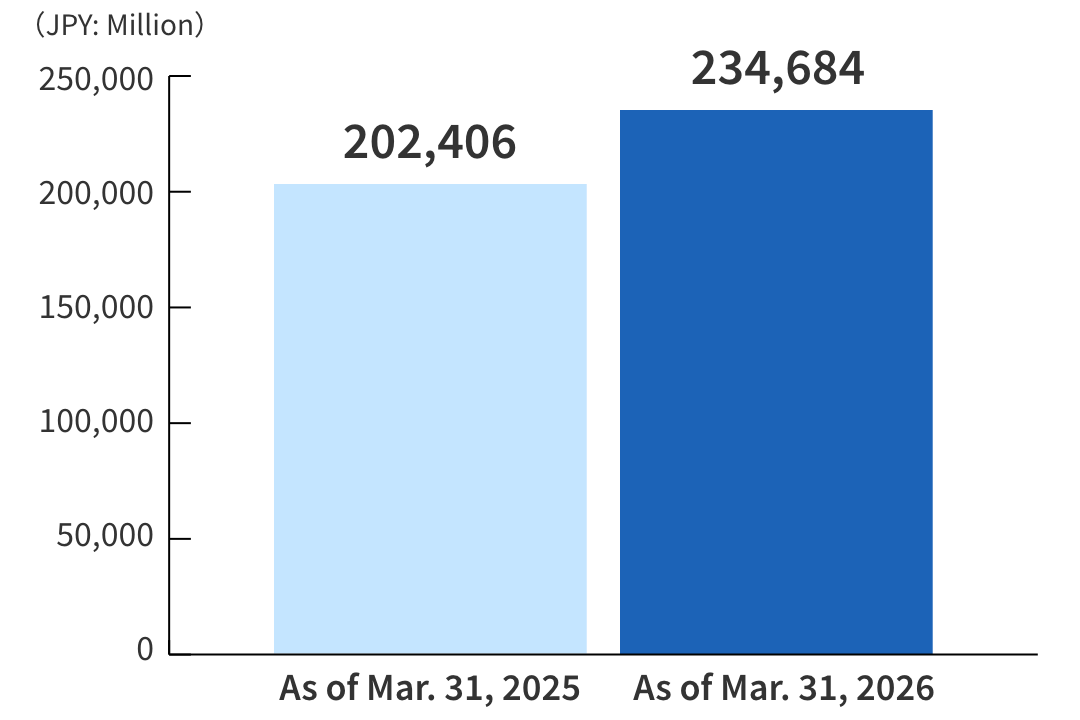
At the end of the current fiscal year, total assets stood at 234.6 billion yen, an increase of 32.2 billion yen from the end of the previous fiscal year. The main increases were 6.4 billion yen in cash and deposits, 2.7 billion yen in accounts receivable-trade, 3.9 billion yen in merchandise and finished goods, 2.0 billion yen in accounts receivable-other, 1.3 billion yen in other current assets, 2.0 billion yen in buildings and structures, net, 1.3 billion yen in tools, furniture and fixtures, net, 3.0 billion yen in intangible assets, 0.9 billion yen in investment securities, 0.9 billion yen in guarantee deposits, 5.9 billion yen in retirement benefit asset, and 1.8 billion yen in investments and other assets.
Liabilities decreased 16.0 billion yen from the end of the previous fiscal year to 78.7 billion yen. The main increases were 2.1 billion yen in accounts payable-other, 2.2 billion yen in income taxes payable, 0.6 billion yen in contract liabilities, 0.7 billion yen in provision for bonuses, 1.9 billion yen in long-term accounts payable-other, and 3.1 billion yen in deferred tax liabilities. The main decreases were 0.9 billion yen in notes and accounts payable-trade, 21.0 billion yen in convertible-bond-type bonds with share acquisition rights, and 5.2 billion yen in long- and short-term borrowings and bonds payable (including current portion of bonds payable.)
Net Assets
(JPY: Million)
| Net Assets | 155,971 | YoY+44.9% |
|---|
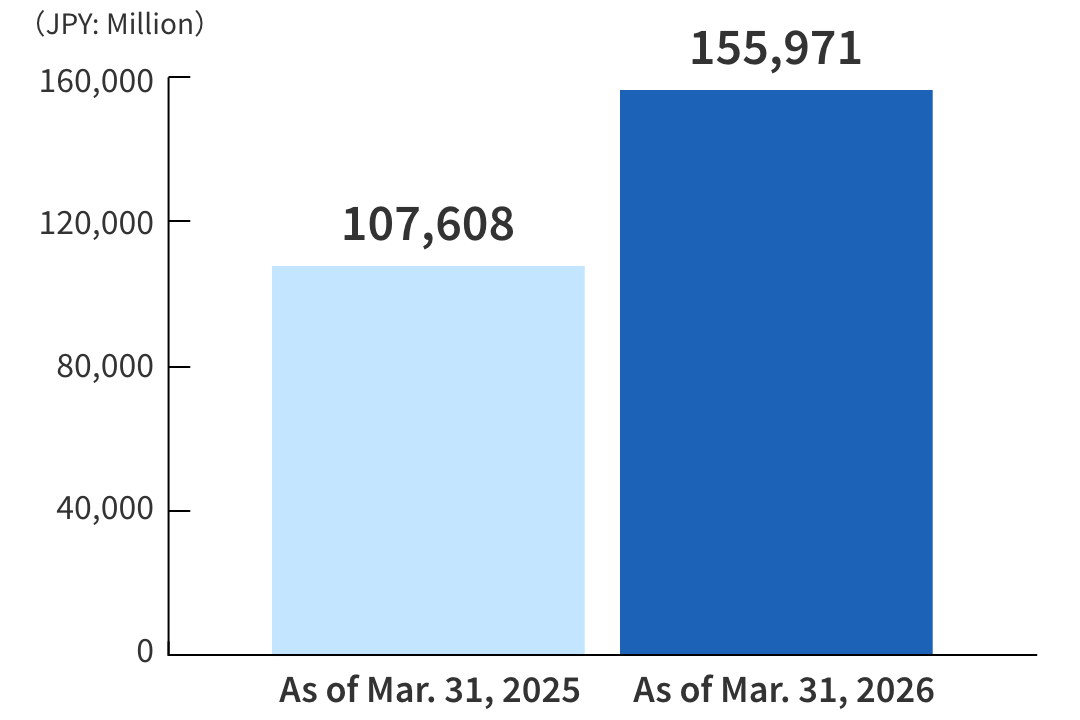
Net assets increased 48.3 billion yen from the end of the previous fiscal year to 155.9 billion yen. The main increases were 12.6 billion yen in capital surplus mainly due to exercise of rights under the convertible-bond-type bonds with share acquisition rights, 39.1 billion yen in retained earnings, 2.1 billion yen in foreign currency translation adjustment, and 2.6 billion yen in remeasurements of defined benefit plans. The main decreases were 7.0 billion yen in treasury shares and 0.7 billion yen in valuation difference on available-for-sale securities.
As a result, the equity ratio was 66.4%, up 13.5 percentage points from the end of the previous fiscal year.